Last year, GitHub shipped contribution graphs on user profiles, and as part of the feature launch I looked back over the previous year with an annotated version of the graph. The gaps in contributions are often as interesting as the streaks and it’s fun to see what you did and where you traveled mapped against the daily push of code.
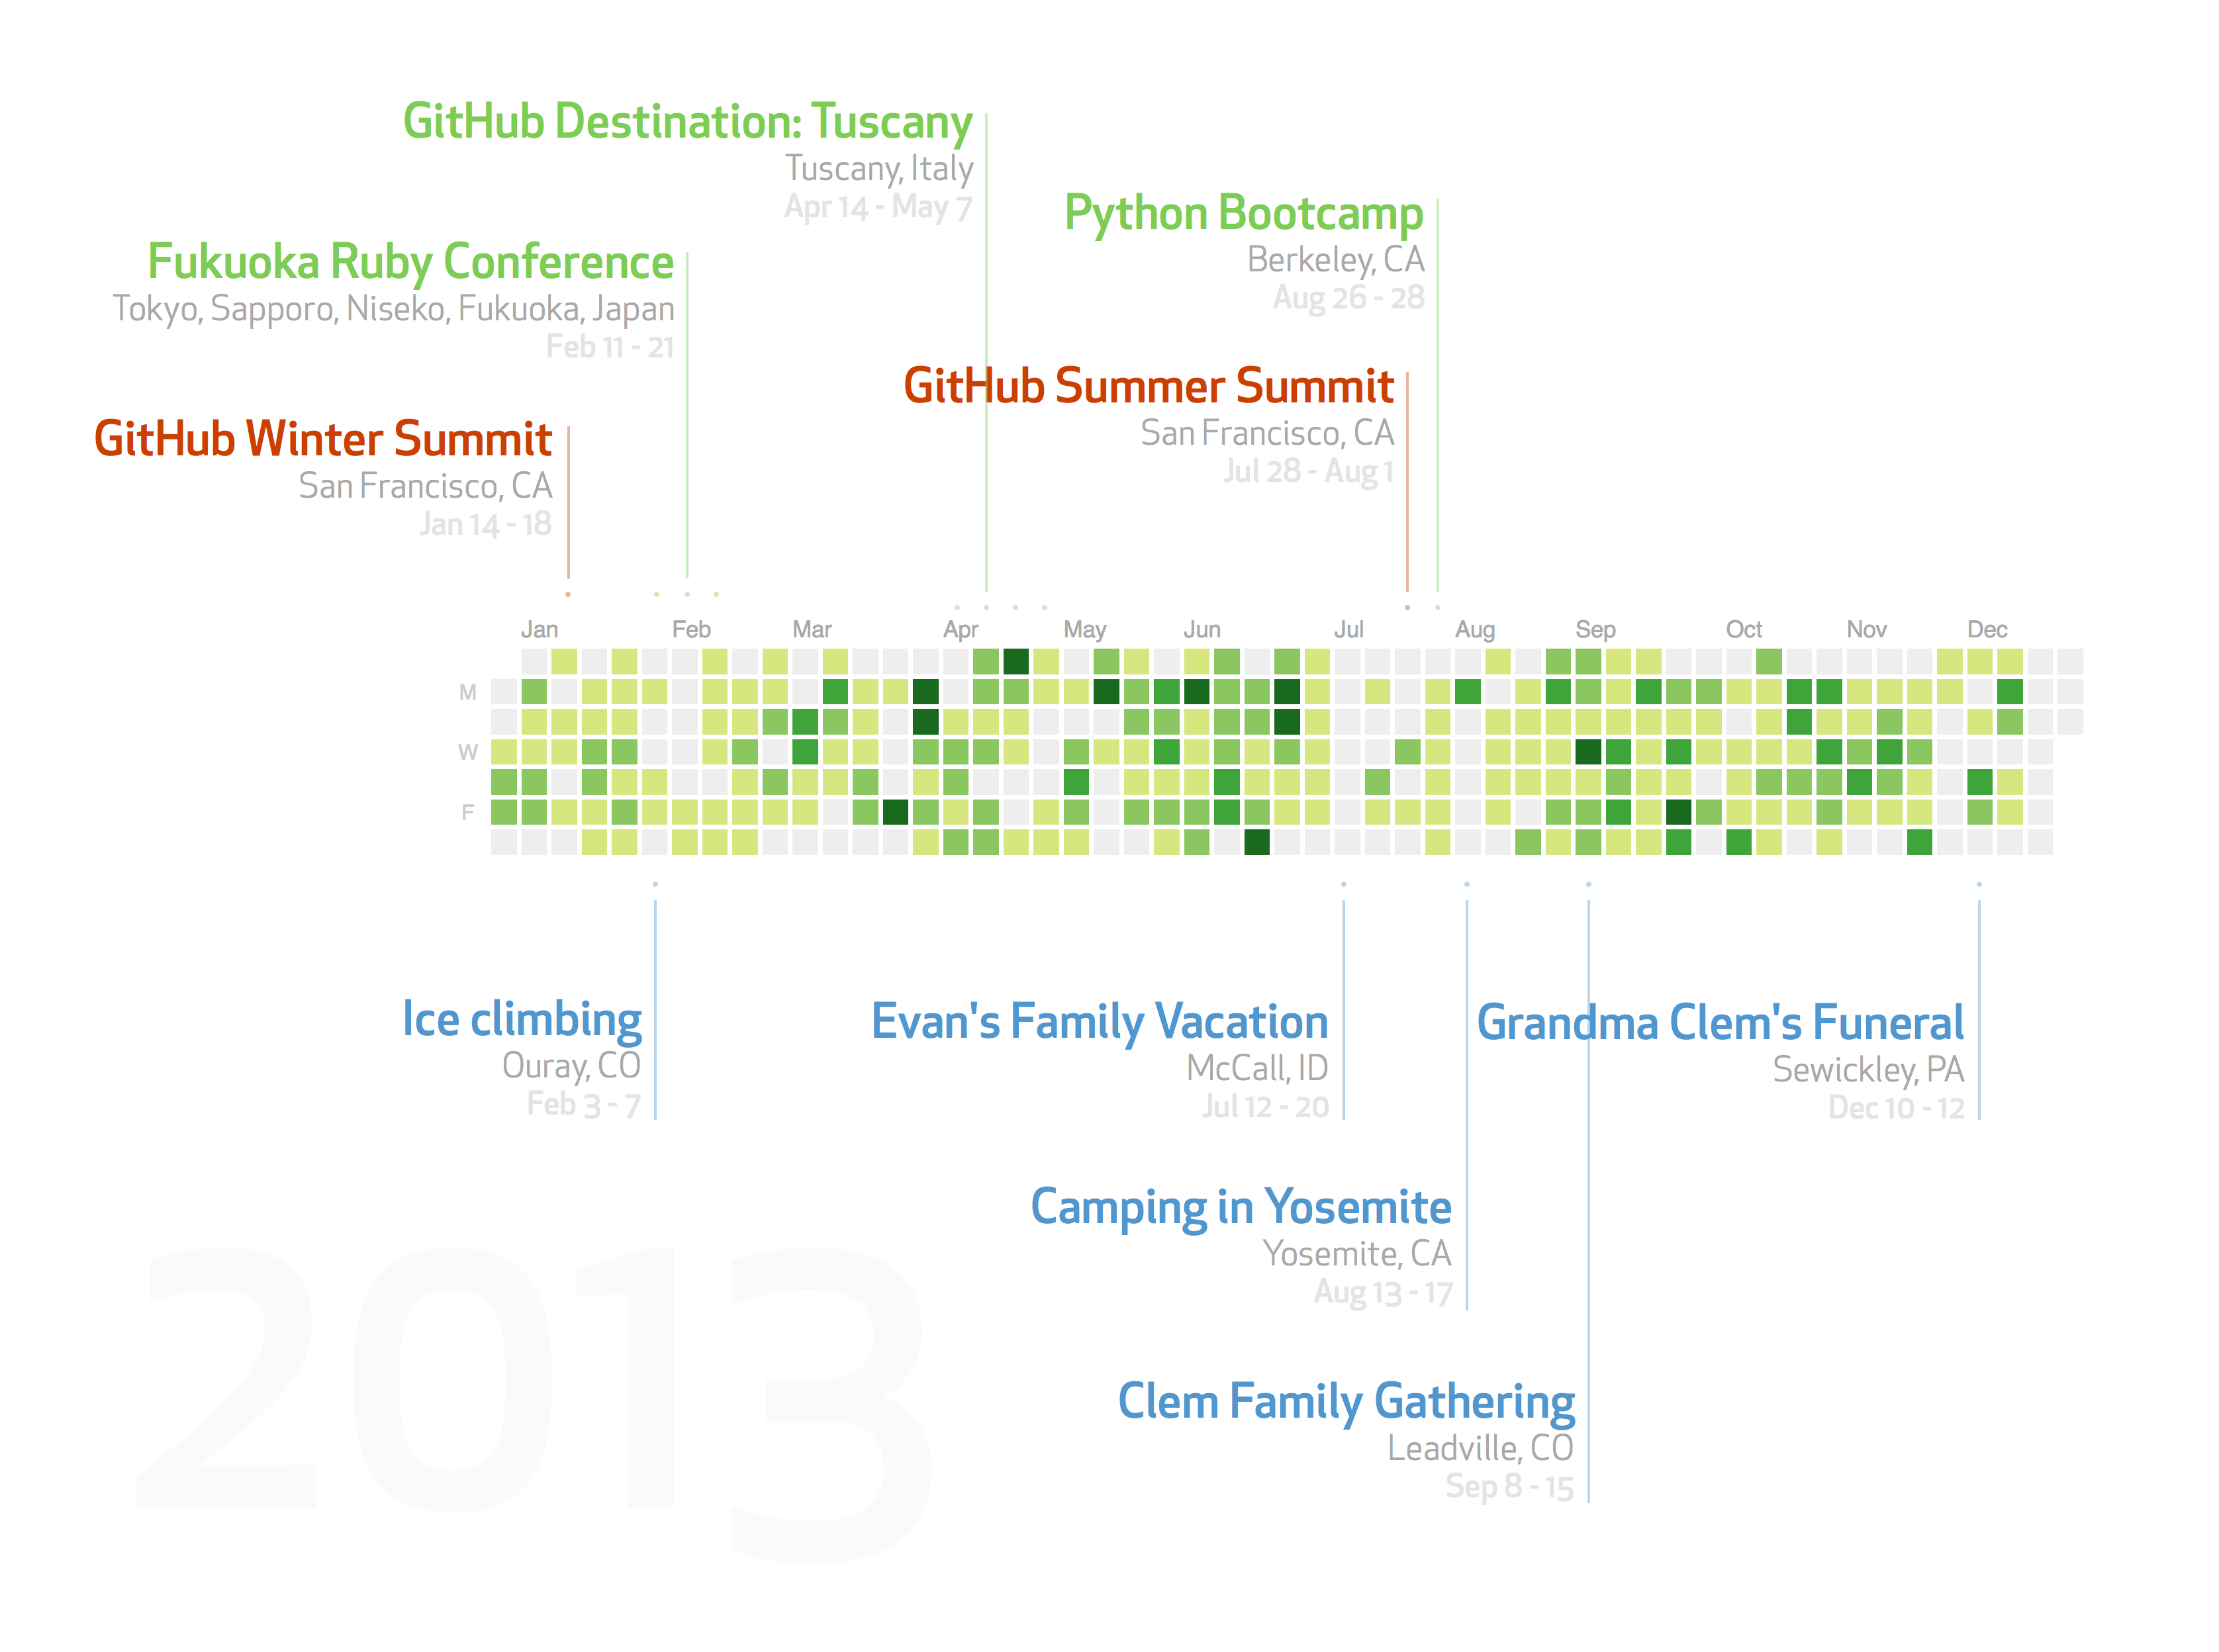
One of my 2013 goals was to travel less with GitHub and spend more time on company strategy, building teams, and all the San Francisco happenings. There were a couple of opportunities I couldn’t say no to, but otherwise I traveled and spoke a lot less than I did in 2012. My job has started shifting away from writing code on a daily basis, but my 2013 graph is still pretty green. This year I plan to move further into strategic and leadership responsibilities, so I’ll have to find a good way to measure activity without those delicious little green squares.
Here’s to 2014!